The Green New Deal and Climate Politics: Flourish Dev Blog #3

The recent launch of the Green New Deal resolution marks a turning point in the politics of climate change in America.  The plan is stunning in its ambition, putting us on a course towards a low-emissions, climate-resilient future with a massive 10 year mobilization of the nation’s resources.  It also recognizes that such rapid changes would come with large societal costs, if safeguards aren’t put in place.  You might think such an ambitious policy would lack public support, but it’s quite the opposite: polls have shown approval ratings above 80%.

The issue of climate change is more in the public eye in America than ever before.  So with this update, we’ll change direction from describing the climate engine to talk a little about Flourish’s political engine: the equations and data behind public opinion in the game.  The engine is fully predictive: it evolves in time, changing in reaction to player choices, random events, and climate.  It also determines the actions that you’re able to take in your country.  If your constituency doesn’t believe in global warming, they won’t allow you to make bold strides to solving the problem.  We think the engine can help predict reactions to the Green New Deal and other climate policies as well.

The engine is heavily based on a series of studies by the Yale Program on Climate Change Communication called “Global Warming’s 6 Americas.”  These studies suggest that Americans can be usefully separated into 6 different groups in terms of their beliefs about climate action.  We summarize characteristics of the 6 groups below.

  • Alarmed: who both accept the scientific consensus about human-caused global warming, and are already taking action to address the problem.
  • Concerned: who accept the scientific consensus but have not yet started taking action themselves.

Note that alarmed and concerned now make up 59% of the country.  Concern about global warming has risen substantially in recent years.   These two categories made up only 43% of the public in 2013.

Six-Americas-2018-Dec.png

  • Cautious: who lean towards accepting the science but don’t think it’s an urgent problem to address.
  • Disengaged: who haven’t thought much about climate change, perhaps because they have bigger problems, because they don’t know about it, or because they don’t think about politics.
  • Doubtful: who often believe that recent climate changes are natural and we’re already doing enough to solve the problem.
  • Dismissive: who believe that climate change is a hoax, and actively try to convince others of their views.

Which of the 6 categories are you?  Although I might wager that if you’re reading this you’re “alarmed,” you can take a 4 question quiz to find out.  Here’s my result:

Alarmed.b2f44521.png

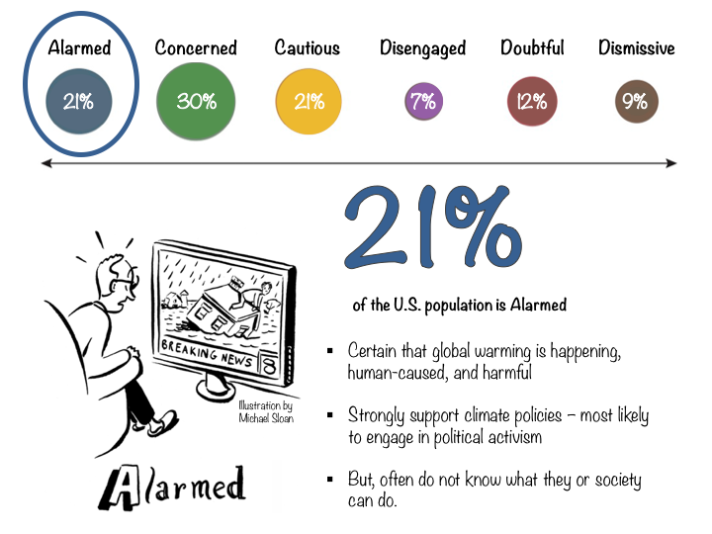
Who wants to be known as Alarmed though??  We’re trying to rebrand this group as “Woke”!

When the first 6 Americas study was released in 2009, I was most struck by how small the dismissive group is.  Their intense interest in promulgating their views means they’re seen disproportionally in public debate, in comment sections of news articles, etc.  But this group simply does not make up much of the public.  Further, research has suggested that the dismissive group are unlikely to ever change their minds.  So dismissives tend not to be worth your time to debate (unless others are listening)!

In Flourish, in every region, whether player- or AI-controlled, we keep track of the fraction of the population that falls into each of the 6 groups.  The initial partitioning into these categories is based on polling data, from the Yale group or extrapolated from international surveys about climate change awareness and threat perception.

In order to calculate the public approval of a given climate action, we keep track of approval rates of each group individually, then add up the totals given the fraction of the population in each group.

Should you be considered that our political engine for the world is based on a set of studies about the US??  We sure are!  We think about conscious biases like these, and the many unconscious biases that must be present in the game on a daily basis.  Our (perhaps meager) justification for 6 Americas as the basis of a worldwide system is that we don’t take the categories too literally in their interpretation.  For instance, while “disengaged” in the US might be associated with those who are not politically engaged, in many countries it would represent people who have immediate concerns that are significantly greater than climate change, e.g., war, hunger, poverty.  Also, it’s just a starting point.  Further complexity can always be built in to correct biases.

Can the Flourish political engine help us understand policies like the Green New Deal and their likelihood of success?  The current high approval rating is doubtlessly due to the fact that it has aspects that appeal to groups who aren’t very concerned with climate, like job guarantees.  Tying climate to economic stimulus makes Green New Deal-style legislation much more likely to have lasting success as compared to initiatives that simply put a price on carbon.

In order for any climate policy to be enacted, however, it has to go through a virtual wringer of opposition from special interests who want it to fail.  These groups are extremely well-funded and powerful, and have been remarkably successful (undefeated?) in the past.  The 2018 Green New Deal-like ballot initiative in Washington state ended up attracting over $31 million in out-of-state oil money to oppose the initiative (over $10 per vote cast!).  Given the huge support rate, the onslaught of opposition attacks from outlets such as Fox News over the last few weeks are not surprising.  Those agents are doing their best to chip away at the 80% who now want a Green New Deal, and are likely succeeding to some extent.

To represent how public opinion responds to attacks like these in a game, we need to think about how public opinion can change.  We use a mathematical technique called Markov chains to describe how the 6 groups evolve in response to events like disinformation campaigns.  This system will be described in the next blog entry.

If you’re feeling “alarmed” and want to support our efforts to build Flourish, you can donate to the EarthGames Support Fund.  Donations right now would go to supporting Andrew McDonald to be a paid undergraduate research assistant on the project.  You can read about Andrew’s prior experiences developing augmented reality games with EarthGames here and here.

Flourish dev blog #2: Global methane emissions

In the last post we wrote about carbon dioxide, the #1 cause of global warming.  But methane, the #2 contributor, is not exactly negligible.  It’s caused 20% of global warming so far.  Each molecule is much more important than CO2: around 30 times as much if considered on a 100 year timescale.

Methane concentrations (as measured in ice cores and direct measurement) have also skyrocketed since preindustrial times:

historicalmethane.png

Compare methane with carbon dioxide, which has risen by 45% since preindustrial times.  Methane reached a 45% larger level than its preindustrial concentration back in the 1920s!  There’s now over 2.5 times the methane in the air than in preindustrial times.  Methane has much smaller concentration than CO2 — 2 ppm vs 400 ppm.

There was some indication recently that concentrations were leveling off, but CH4 is back on the rise since 2006:

recentmethane.png

Natural gas is mostly methane, and so is swamp gas, which is produced in wetlands by tiny microorganisms called methanogens.  Methanogens work well in warm, wet, low-oxygen environments, so wetlands or flooded rice patties are big sources.  So are the bellies of cows, sheep, and goats — and even termites!  Methane is a big reason why beef has such a high carbon footprint.

There’s a lot of methane locked up in permafrost and ice in the Arctic, and there’s also huge amounts of frozen organic material that’s ripe for decomposition by methanogens.  Certain Arctic lakes have methane bubbling to the top, where they can be lit on fire!  There’s concern about these sources releasing or creating more methane as the climate warms, leading to an amplifying feedback that causes even more warming.  Scientists are closely monitoring methane emissions in the Arctic, and worldwide, to identify potential surprises.

However, it’s quite difficult to estimate with precision how much methane comes from different sources.  Estimates from the individual sources on the ground don’t add up to the atmospheric increase/sinks.  Different groups provide their own estimates of the sources, three of which are shown below (GAINS-ECLIPSE5a and EDGARv4.2EXT from the Global Methane Project spreadsheet and CEDS).

recentmethaneemissions.png

Why would methane concentrations have stabilized starting in 2000, and accelerated in 2006, if there were no matching trends in the anthropogenic emissions?  Scientists are still arguing about that one, but it could be that natural wetland sources have changed, that concentration of the hydroxyl radical (the main way methane breaks down) in the atmosphere has changed, or that we haven’t accounted all the sources well enough.

About those anthropogenic sources.  Leaking coal mines, natural gas wells, and pipelines contribute a tremendous amount to methane emissions, and have risen sharply since the early 2000s (data from CEDS):

methanesectors.png

For example, the Aliso Canyon natural gas storage facility in Los Angeles began spewing tons of methane (watch infrared video footage here) and other chemicals in October 2015.  Local residents began suffering from headaches, nose bleeds, and other illnesses, and eventually thousands of families were forced to evacuate.  The leak wasn’t capped until February 2016, by which time over 100,000 tons of methane had leaked.

There is little government oversight on these wells, and industry self-regulation is not exactly stellar.  Check out this article for descriptions of some of the utter failures of risk management in the industry.  SoCalGas recently agreed to a $119M settlement, which will go to offsetting methane emissions across the state, a long-term health study of affected residents, and environmental justice-related projects, among other projects.

Imagine 1500 Aliso Canyon blowouts each year.  That’s the best estimate of fugitive methane leakage from coal, oil, and natural gas facilities across the world.  Could we be doing a better job at detecting leaks?  The Environmental Defense Fund plans to launch their own satellite called MethaneSAT for much-needed oversight on fugitive fossil fuel emissions.

Waste
The waste category includes methane released from landfills and water treatment.  Note this source has more than doubled since 1970.  There are ways to mitigate these, e.g., capturing biogas from landfills or installing methane digesters to water treatment facilities.  And we shouldn’t forget (gasp!) creating less waste.

Rice
Rice is typically grown in flooded fields, which create anoxic conditions that methanogens love.  There are well-known methods to reduce these emissions and grow more efficiently at the same time.

Animals
Finally, animal agriculture is another major source of methane, specifically ruminants that have multiple stomachs for digestion.  Cows, goats, and sheep all burp out large amounts of methane in their digestive system.  There simply wouldn’t be nearly as many cattle on the planet if it wasn’t for our appetite for beef.  When combined with the inherent inefficiency of animals as a calorie source (it takes 30 pounds of feed to create 1 pound of beef, per the USDA), the meat industry has an extremely high carbon footprint.

Are we shifting towards less meat intensive diets?  Definitely not — as the world becomes more rich, more and more people are demanding more meat in their diet.  Projections suggest that satisfying the demand for more meat is the main challenge for feeding the world in future decades, not rising populations.

The future doesn’t have to be like these projections though.  That’s why we’re making Flourish.  If you want to support our efforts to build this game, you can donate to the EarthGames Support Fund.  Donations right now would go hiring a paid student research assistant.

Flourish dev blog #1: Global carbon emissions

Hi everyone,

We’ve moved development of Flourish temporarily into python, so I thought it might be a good time to summarize some of the equations and data sources that we’re using, as we code them into the new language.

First topic: data sources for historical carbon emissions, at a global scale.  All the code (Jupyter notebook) and data used to make these figures are available here.

If this is a game about the future, why do we need to know about the past?  First, the player starts from a realistic depiction of the world today.  We need to know the most recent pollution data as accurately as possible because that’s what the player will be setting out to reduce.  Second, trends in pollution can help us understand potential futures.  The direction a particular country or sector is heading is useful information for where it might end up.

Global Carbon Project has fantastic data about CO2 emissions in all countries of the world.  We used Global Carbon Budget 2018 data, which has emissions up until 2017.  Historical data goes back to 1751 for fossil fuels and industry, and 1850 for land use changes.

historicalcarbon.png

Land use change was a bigger contributor to CO2 emissions than fossil fuels up until 1950.  Fossil fuels and industry carbon emissions have quintupled since then; land use emissions are similar.

Breakdown into individual fossil fuels, cement and flaring:

fossilcarbon.png

2017 emissions were 3.98 GtC (coal), 3.45 GtC (oil), 1.97 GtC (gas), 0.4 GtC (cement) and 0.068 GtC (flaring).

There’s a plot on the GCP site that shows the full carbon cycle, along with reservoir sizes, including coal, oil and gas reserves:

essd_2018_fig02a_1.png

There are uncertainties in this data of course, but if you take the numbers at face value, they can be used to estimate the number of years left of each fossil fuel, if emissions were to stay the same as today.  This calculation suggests there is between 110-135 years of coal, 50-80 years of oil, and 195-575 years of gas.  Or calulating with the sum of the three fossil reserves, the minimum estimate of 1005 GtC could sustain 10 GtC/yr emissions for 100 more years, the maximum could sustain current emissions for 200 years.  Ugh…

Airborne fraction is defined as the amount of CO2 that sticks around in the air, instead of going into the ocean or land.  The atmospheric increase is noisy!  Any rate of change is noisy if estimated from imperfect time series data (the time derivative increases variability at short time scales).  Much of the variability is real though; during strong El Nino events, increases in forest fires lead to more carbon released into the atmosphere and a higher airborne fraction.

airborne.png

The large variability of the land sink in particular can be seen in this GCP plot (note that it’s measured in GtCO2 instead of GtC)

s45_Global_Sources_and_Sinks_newcm.png

The game takes all the carbon emissions from across the world, and then uses a carbon cycle model to decide how much goes into the ocean (where it causes acidification…), into the land, or into the atmosphere.  Parameterizing the land sink is more difficult than the ocean component of the carbon cycle model; we’ll discuss both in a future post.

In the next post we’ll move on to methane, then other greenhouse gases including nitrous oxide and halocarbons, and other radiative forcings.  Then we’ll zoom into country- and regional-scale breakdowns.

Want to support the development of Flourish?  You can donate to the EarthGames Support Fund.  Donations right now would go to support a paid undergraduate research assistant.