Hi everyone,
We’ve moved development of Flourish temporarily into python, so I thought it might be a good time to summarize some of the equations and data sources that we’re using, as we code them into the new language.
First topic: data sources for historical carbon emissions, at a global scale. All the code (Jupyter notebook) and data used to make these figures are available here.
If this is a game about the future, why do we need to know about the past? First, the player starts from a realistic depiction of the world today. We need to know the most recent pollution data as accurately as possible because that’s what the player will be setting out to reduce. Second, trends in pollution can help us understand potential futures. The direction a particular country or sector is heading is useful information for where it might end up.
Global Carbon Project has fantastic data about CO2 emissions in all countries of the world. We used Global Carbon Budget 2018 data, which has emissions up until 2017. Historical data goes back to 1751 for fossil fuels and industry, and 1850 for land use changes.
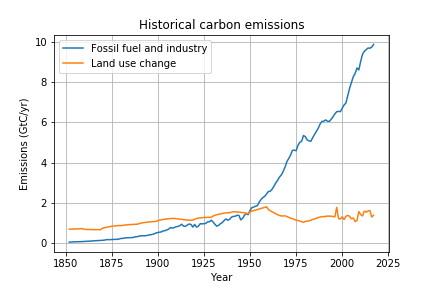
Land use change was a bigger contributor to CO2 emissions than fossil fuels up until 1950. Fossil fuels and industry carbon emissions have quintupled since then; land use emissions are similar.
Breakdown into individual fossil fuels, cement and flaring:

2017 emissions were 3.98 GtC (coal), 3.45 GtC (oil), 1.97 GtC (gas), 0.4 GtC (cement) and 0.068 GtC (flaring).
There’s a plot on the GCP site that shows the full carbon cycle, along with reservoir sizes, including coal, oil and gas reserves:
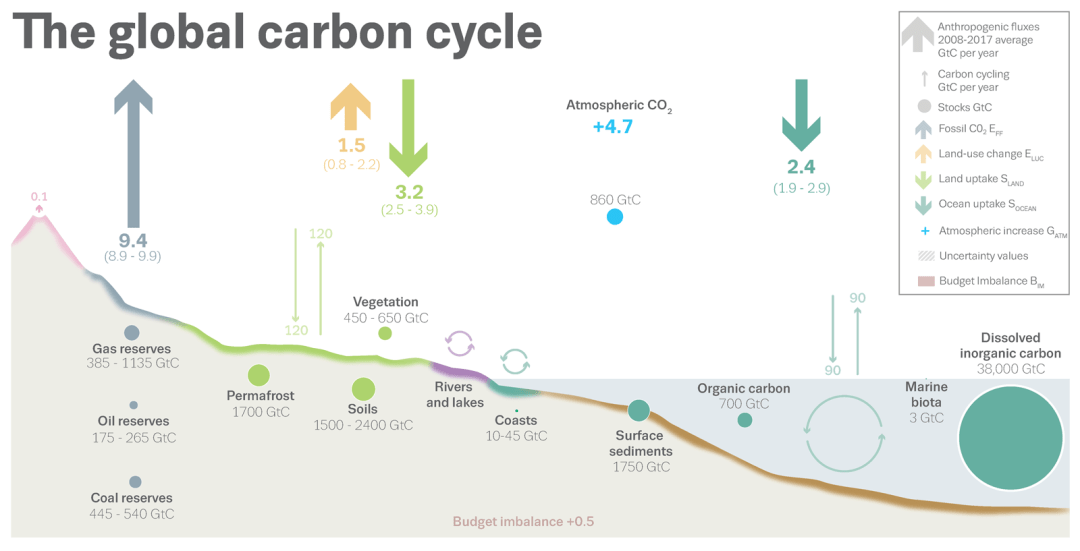
There are uncertainties in this data of course, but if you take the numbers at face value, they can be used to estimate the number of years left of each fossil fuel, if emissions were to stay the same as today. This calculation suggests there is between 110-135 years of coal, 50-80 years of oil, and 195-575 years of gas. Or calulating with the sum of the three fossil reserves, the minimum estimate of 1005 GtC could sustain 10 GtC/yr emissions for 100 more years, the maximum could sustain current emissions for 200 years. Ugh…
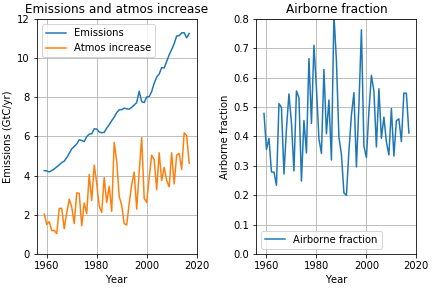
Airborne fraction is defined as the amount of CO2 that sticks around in the air, instead of going into the ocean or land. The atmospheric increase is noisy! Any rate of change is noisy if estimated from imperfect time series data (the time derivative increases variability at short time scales). Much of the variability is real though; during strong El Nino events, increases in forest fires lead to more carbon released into the atmosphere and a higher airborne fraction.
The large variability of the land sink in particular can be seen in this GCP plot (note that it’s measured in GtCO2 instead of GtC)
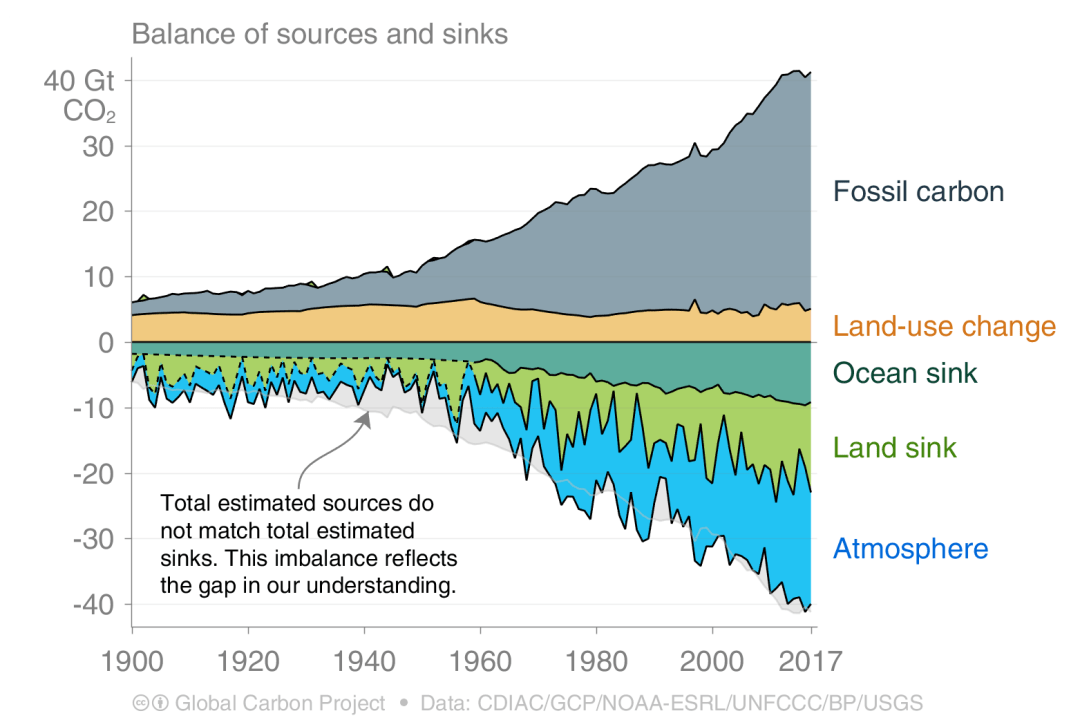
The game takes all the carbon emissions from across the world, and then uses a carbon cycle model to decide how much goes into the ocean (where it causes acidification…), into the land, or into the atmosphere. Parameterizing the land sink is more difficult than the ocean component of the carbon cycle model; we’ll discuss both in a future post.
In the next post we’ll move on to methane, then other greenhouse gases including nitrous oxide and halocarbons, and other radiative forcings. Then we’ll zoom into country- and regional-scale breakdowns.
Want to support the development of Flourish? You can donate to the EarthGames Support Fund. Donations right now would go to support a paid undergraduate research assistant.

2 thoughts on “Flourish dev blog #1: Global carbon emissions”